AppAnnie has been for a long time now the leading mobile data & analytics company. It’s also one of the must-have tools if you are a dev trying to do some ASO for your apps (even the free tier is worthwhile). Anyway, every year they publish a report that includes the most important insights of the mobile world that happened in the previous year. It’s called “The State of Mobile”, and they’ve just published it for 2020.

For any mobile devs that are interested in growing their app/game, this is a must read. Not only that it gives insight into the mobile world, but it also shows the impact of mobile across industries and the global economy. You can download the new report here (email address required): The State of Mobile 2020
You can read some highlights of this report here (for full details I recommend downloading the full report):
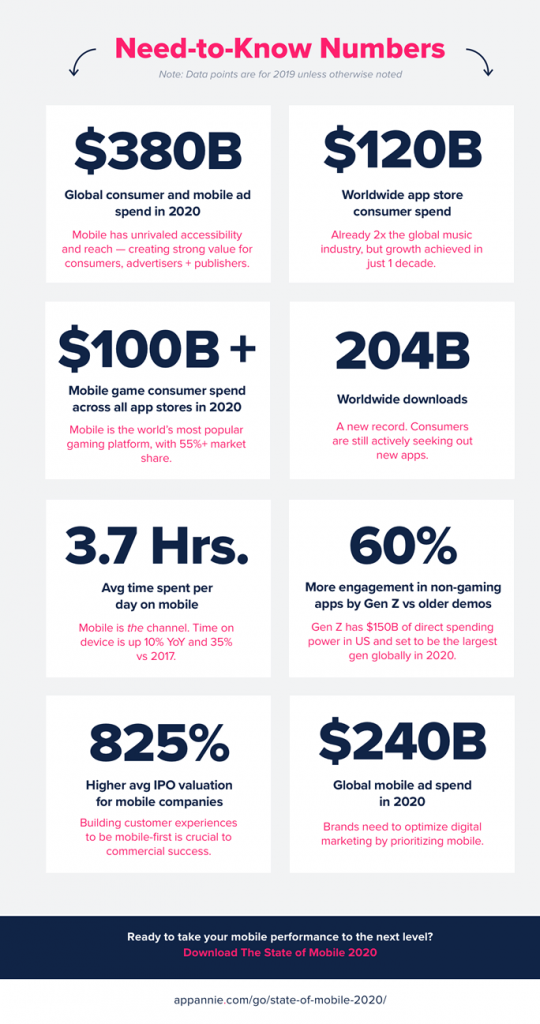
- 204 billion apps downloaded. In 2019 there were 204 billion app downloads, a 6% yearly increase. This excludes re-installs and app updates, so only new app downloads.
- India dominates the top for most downloads. Close to 40 Billion app downloads came from India, followed by the US with 12.3 Billion downloads.
- 72% of all app store spend is game-related. Consumers spent $120 billion in 2019 across all app stores (iOS, Android, third party). 72% of that was spent on games.
- Almost 4 hours/day spent on mobile. Users are spending 3 hours and 40 mins in average per day on their mobile devices.
- In-app subscriptions accounts for 96% of spend. Apps with subscription payments account for 96% of total spend for apps (excluding games). Tinder, Netflix and Tencent topped the charts.
- Alexa topped the IoT download charts. Most downloaded IoT app in 2019 was Amazon Alexa, followed by Roku and Google Home.
- 2020 will be the highest grossing for mobile ads. $190 billion was spent on mobile ads in 2019, and in 2020 it’s expected to reach $240 Billion.
- Mobile gaming is the most popular gaming type. In 2019, mobile games had 25% more time spend than all other gaming combined.
- Casual Arcade is the top category. 47% of all game downloads was for casual Arcade games in 2019, followed by Puzzle games.
- South Korea leads in revenue/user. The highest average revenue per user was for South Korean consumers (followed by Japan and China).
- 1121 games surpassed $5 million in revenue. 17% more games surpassed an annual consumer spend of $5 million in 2019 compared to previous year.
- Financial apps on the rise. Consumers accessed financial apps over 1 trillion times in 2019. User base growth of fintech apps topped traditional banking apps. “Cash App” was the no.1 most downloaded fintech app in the US.
- 50% more sessions spent in entertainment apps. Compared to 2017, users spent 50% more time in streaming apps in 2019. Top players in the Entertainment area are Netflix, Amazon Prime, HBO and the more recent Diney+, AppleTV and TikTok.
- Social apps rule. 50% of time spent on mobile in 2019 was for social and communication apps. Games only accounts for 9%. TikTok is on the rise with 68 Billion hours spent by users in 2019.
- $2.2 billion spent on dating apps. That’s a 2x increase from 2017. Tinder obviously dominates the market.
- Whatsapp and PUBG had the most active users. In apps, the top is dominated by Whatsapp, Facebook and WeChat in terms of monthly active users. In gaming, PUBG Mobile and Candy Crush.
- Facebook as the top 3 most downloaded apps in 2019 (Facebook Messenger, Facebook and Whatsapp). In gaming, Free Fire is the most downloaded game of 2019, followed by PUBG Mobile.


