
Performance-based ASO, huh?
In simple terms, you could say that ASO (app-store optimization) is basically SEO for apps. However, ASO should be much more than that. Many devs just think of app-store optimization as a way to have their app shown higher in search results done on Google Play (or the iOS App Store) and drive more traffic to their listing. While one of the purpose in a good ASO strategy is driving more traffic to your app’s listing page, that’s only one element. You see, even if you drive more traffic, your install base could remain the same if that traffic is not correctly targeted. That could happen for instance if you optimize your app’s listing for a very popular keyword which might have multiple meanings, instead of choosing a mid/long-tail keyword (much more accurate). That’s only one example but there could be many, ASO shouldn’t be all about getting more visitors to your listing page. It should be performance based.
Your ultimate goal is getting more revenue without degrading your app’s quality (i.e. bloated with ads). This is directly linked to true installs, meaning users that visit your listing page, install the app and don’t uninstall it soon after. That’s what performance-based ASO is about, that suite of actions you take with the purpose of achieving a goal (i.e. more revenue) while continuously monitoring the output of those actions. Don’t just start changing your app’s title/icon/screenshots/description to whatever you think will work best without testing how that affects your ranking, installs and/or revenue. If you don’t have a way to track the results of your ASO strategy you won’t know what works and what doesn’t when it comes to optimizing your listing. A lot of devs will say that if you grow your traffic the rest will follow but that’s not always the case. Do you know what happens to your revenue if your average rating goes down, even if traffic to the page is higher? Or what is the correlation between install numbers and your chances of being featured in a Top Chart? Or how chart rankings & keyword rankings influence your installs? I could go on and on but the conclusion is the same, always focus on performance rather than just views when it comes to ASO for your app/game.
Meet TheTool
Luckily, unlike a few years back when mobile apps were at their infancy, there are also a lot of tools to track ASO performance and help you in understanding what changes work best for your app. TheTool.io is the newest player in the performance-based ASO tracking market, and the fact that it offers a free tier and also a free trial for all its tiers makes me recommend you to give it a shot. The striking difference between it and other ASO tools is its simplicity in providing you the graphs that help track ASO performance better. As soon as you create an account you can start adding apps and track rankings, installs, revenue and all correlations in between these and also be alerted via email whenever something impactful happens.
TheTool’s Main Features
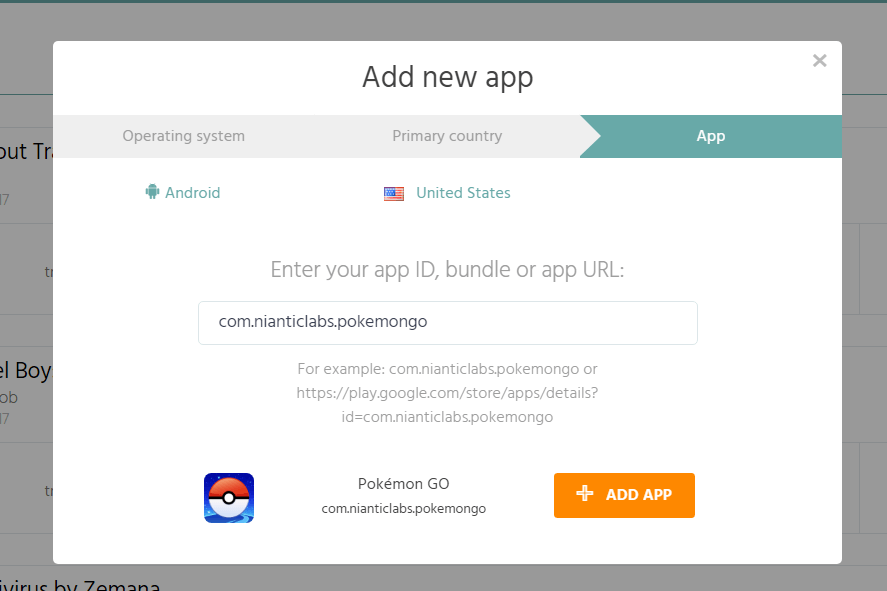
Quickly add your apps.
The first thing you have to do is add the apps you want to track ASO progress for. The free plan allows you to track progress for up to 2 apps, while the paid ones will allow 5, 15 and 50 apps respectively if you really want to be an ASO Ninja. When adding an app you’ll be able to choose the OS between Android and iOS (both are supported), then select a country you’d like reports for (over 91 supported) and lastly just type the app package name to add it. Now, for an indie dev or small studio a few apps would suffice, however no one says you have to use TheTool only for your apps. In fact it’s quite recommended to add your competitor’s apps (or at least the main ones) to track their performance.
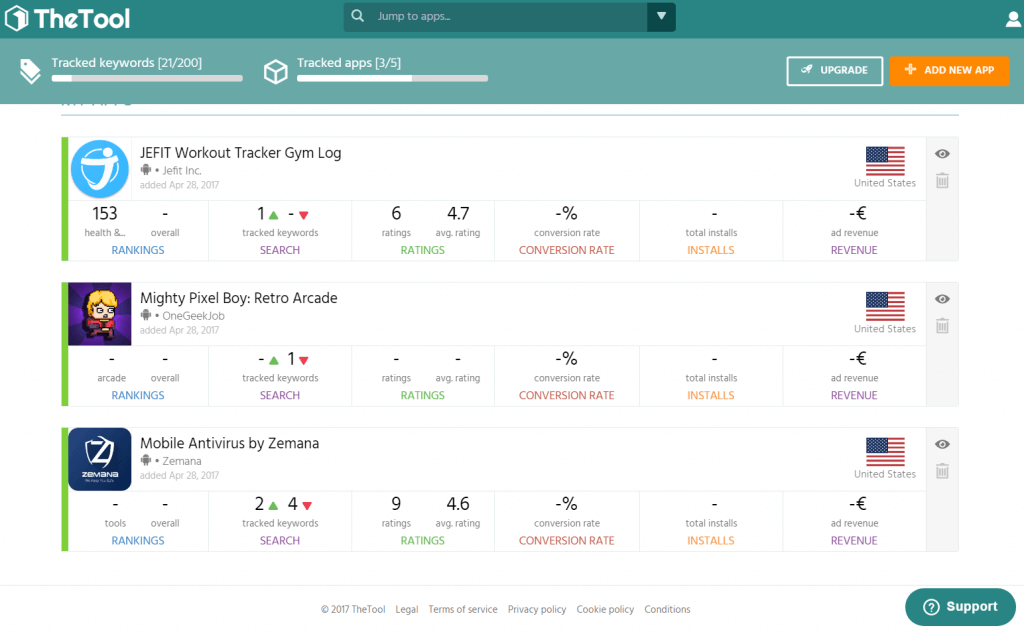
ASO overview.
I like how TheTool offers a quick overview of how all your apps perform once you’ve added them all. Everytime you login you’ll be able to see quick stats under each app showing how Rankings, Search, Ratings, Conversion Rate, Installs and Revenue progressed over the tracked period. Ideally you’d see only green (growth) icons, but that’s what TheTool is for, to help you improve your app’s presence and “go green”.
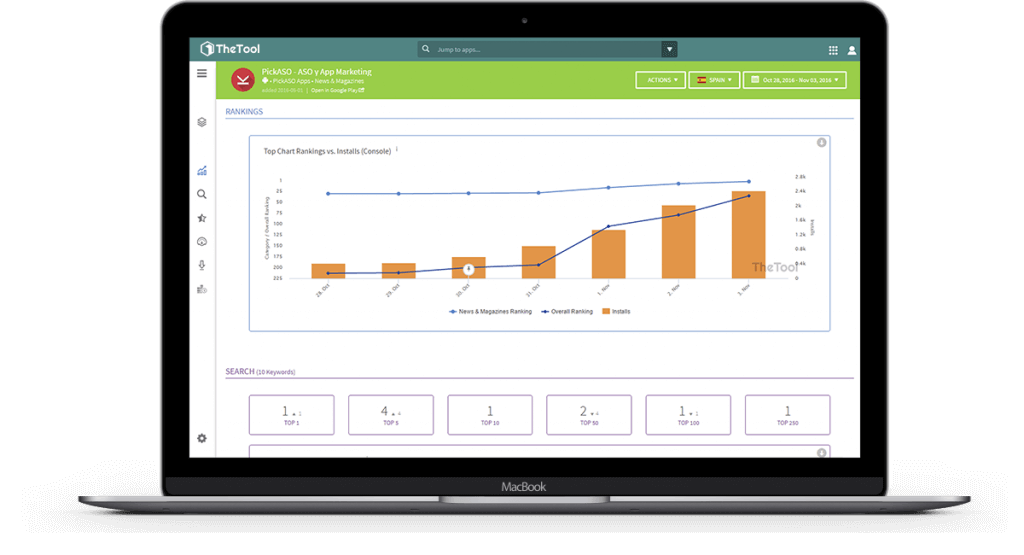
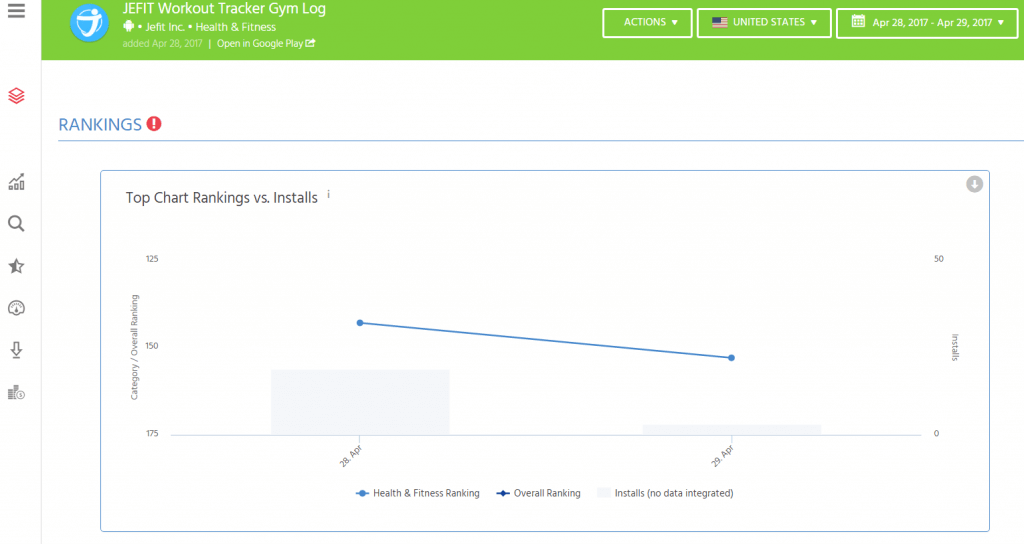
Top charts rankings tracking.
TheTool is able to provide all these performance based stats that otherwise would be difficult to achieve. The Rankings section will show you how your app’s position in the top charts changed over time. However, that’s not a simple line graph that shows that your app was in X position yesterday and today is X+5, it cleverly combines this with the variation in installs – assuming you’ve connected your developer account to send in stats about installs in your TheTool account.
This way you can quickly see the correlation between ranking higher in your category and installs. What happens to your app’s Top Charts ranking if you get a boost in installs? Or vice-versa, what happens to your install base once you’ve hit the jackpot and are in one of the top 10 categories? Obviously the second question is easier to answer, as the higher your position, the more visibility for your app and thus more installs – however the true installs number is also a ranking factor so the more users your app gains and retains, the better your ranking.
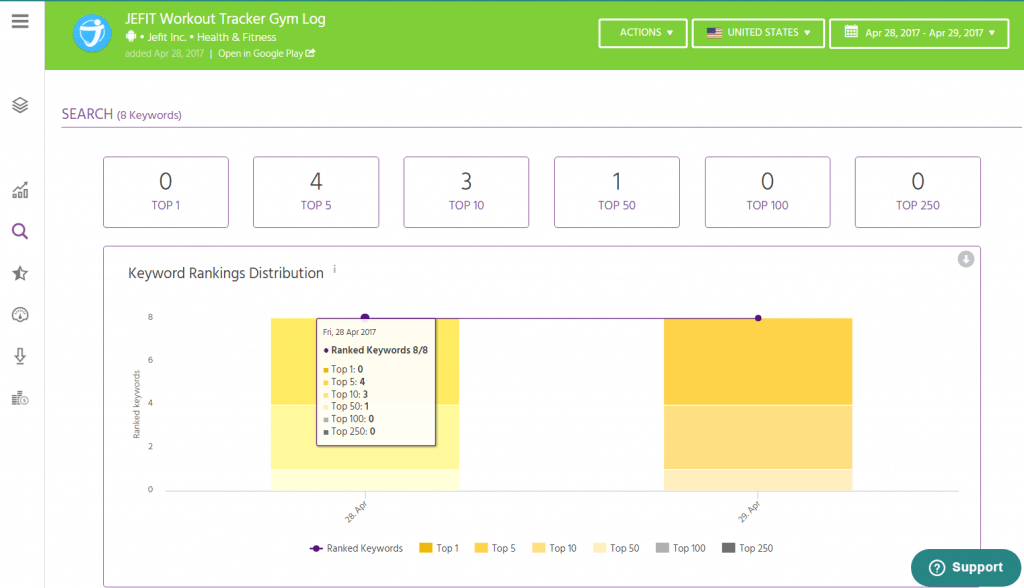
Keyword tracking & research.
Picking the right keywords and optimizing for those is the most important aspect of ASO. And this is not a one time thing, it’s a continuously testing & improvement process. TheTool has 2 elements that help you with this part of ASO, the keywords rankings tracking & its keywords suggestions. For each app you’ll be able to add a set of keywords to track the ranking. You’ll also see advanced details about each keyword, such as its difficulty (i.e. in ranking for it), how popular it is, how many competitors will show for it and lastly your apps’ rank for it with an absolute change.
Ideally you’d find the perfect keyword that has some traffic, its difficulty is low, competitors are few and it fits just right with what your app does.
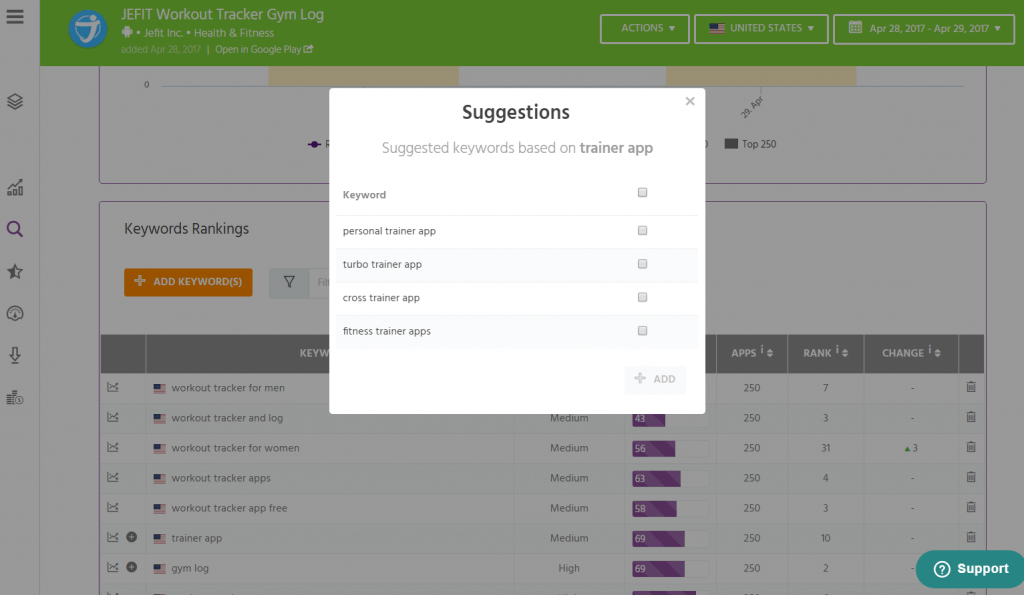
You’ll also get keyword suggestions from TheTool to expand your tracking, especially mid/long-tail keywords. These are very useful if you’re on a tight budget and cannot compete with big studios in targeting the most popular searches. Focusing on long-tail keywords you increase your chances at being found and have more visibility for the app. You’ll also be able to correlate any changes you’ve made to how your keywords rankings changed (i.e. changing your app title or description) and adjust accordingly.
User ratings tracking.
User ratings (and their value) are a key part of ASO, as it influences your position in Google Play’s search results. It is one of the factors and obviously the more you have, the better your ranking will get (if the average rating is good too). And not only for ASO, for conversions as well. New visitors to your app’s listing will decide to install it based on its score & ratings too – obviously everyone avoids 1-star apps, so treat ratings as a crucial element of your ASO strategy.
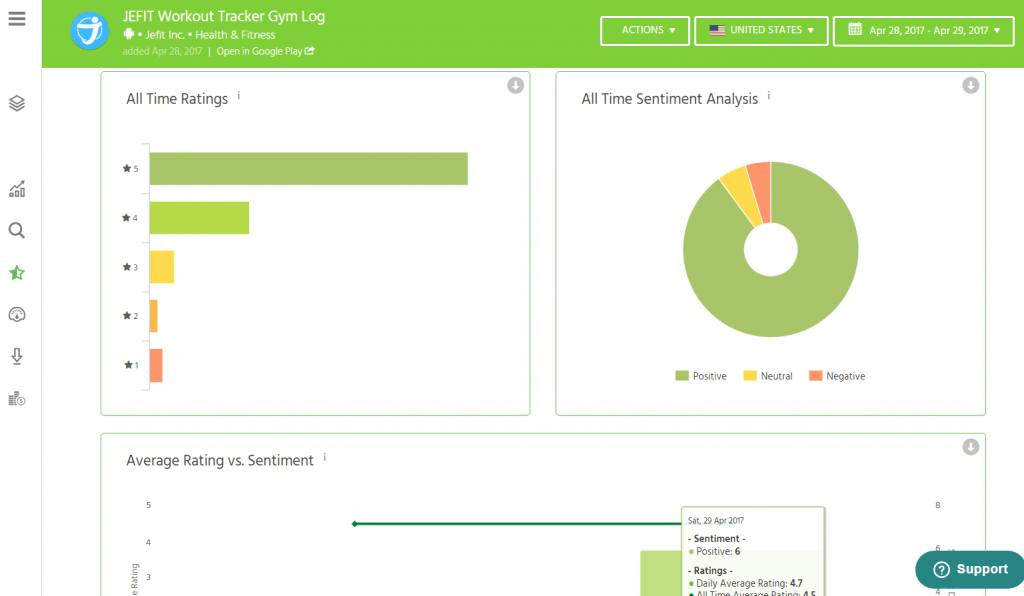
TheTool offers several graphs to help you see the influence of ratings on your ASO strategy. Aside All Time Ratings (that shows in Google Play too) you’ll be able to see an all-time sentiment analysis graph for your ratings. This doesn’t just look at the rating value, it also takes into account if the posted review is positive or not. Next, it will show you the correlation between the average rating value and the sentiment analysis for reviews. Last but not least, you will see a graph that combines the number of ratings with how your installs changed over time.
Track your installs.
TheTool is a performance-based ASO tool thus its usefulness is maximized only if you integrate your app developer account with it. The integration is very simple to do (nothing to change in your app) and once you do that you’ll have stats about your installs & revenue showing alongside the other ranking graphs.
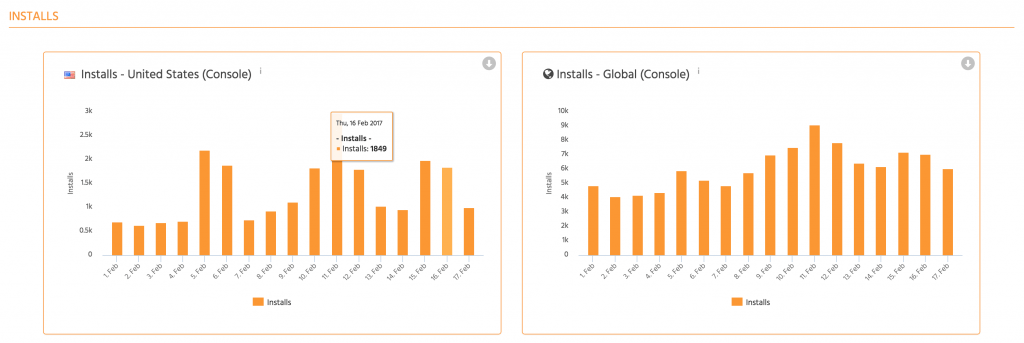
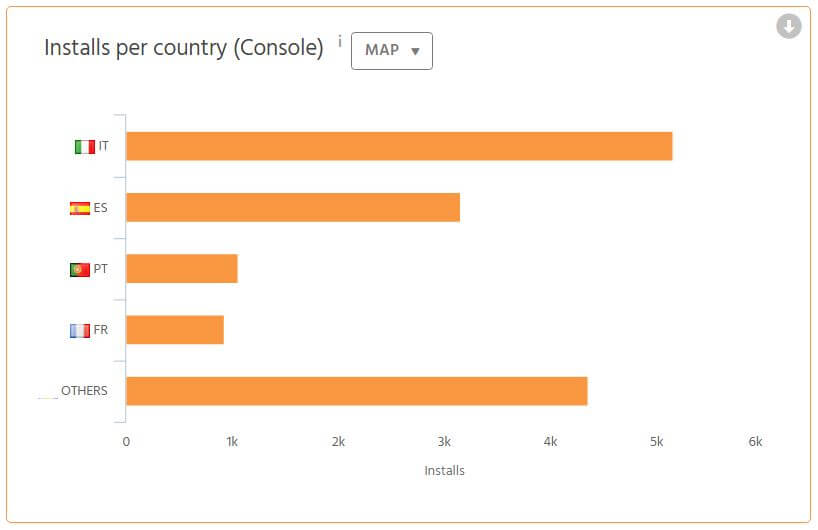
The Installs reports will show you variation of absolute installs for the particular country you picked to monitor, global installs, as well as a comparison of country vs. global installs. This helps to answer important questions and see for instance what the impact of localizing your app has on the number of organic installs. As mentioned previously, you’ll also be able to see the influence of top chart rankings on installs and vice-versa.
Conversion rate tracking.
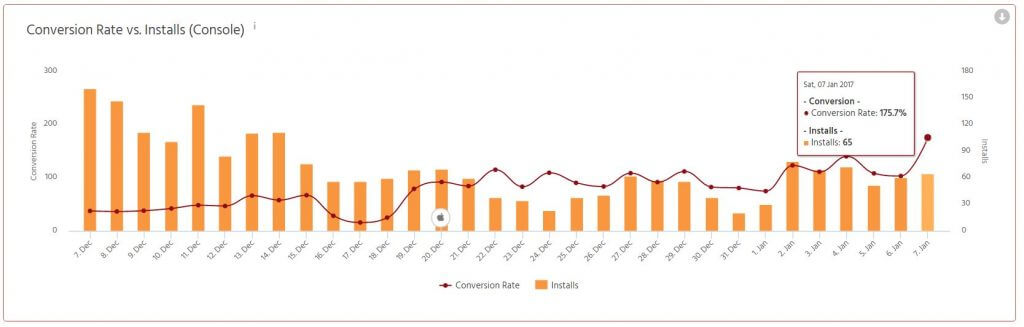
This is in strict relation with Installs tracking, but shows a relative change rather than absolute. In bulk terms, conversion rate is the percentage of visitors to your listing page that installed your app and became users. Ideally it should reach the skies but generally everything above 10% is good. Knowing what your conversion rate is will help in deciding if the changes you did as part of your ASO strategy are working. For instance, if you change the icon, screenshots, feature graphic, video demo will your conversion rate go up? The conversion rate tracking graphic will help you take the best decision and see what works and what doesn’t – plus viewing conversion rate by country you can see where your app needs improvement and how localization influences it.
Revenue tracking.
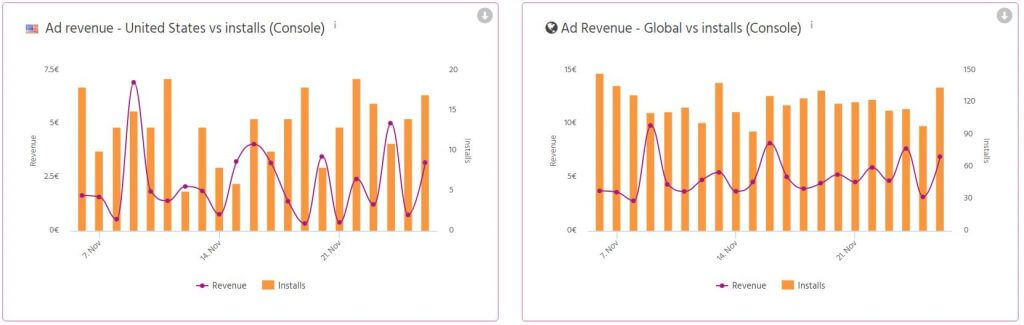
These reports are useful if you show ads within your app. Granted, all ad networks for mobile apps will offer their own reports, but having them all in TheTool will give you the advantage of noticing correlations between other ASO elements (i.e. what happens with revenue when you localize, how does conversion rate influence revenue and so on). Right now it will allow integrations with Google’s AdMob, with more to be added in the near future.
The graphs that give you more insights compare how the no. of installs influences your app’s revenue for the particular country you decided to track and also worldwide.
Other useful tools.
Google Analytics/Adsense offers for quite some time now the possibility to add annotations and thus see if a particular change you did to your site influences the traffic. TheTool has a similar feature for its graphs as well (included in the top tier package) where you’ll be able to add annotations and thus have a historic overview of what changes you did and how did those influence your rankings, installs or conversion rate. Another useful tool is the possibility to export data to CSV files and thus perform more advanced analysis on it in Excel.
These features will be soon followed by other interesting ones, so stay tuned.
Conclusion
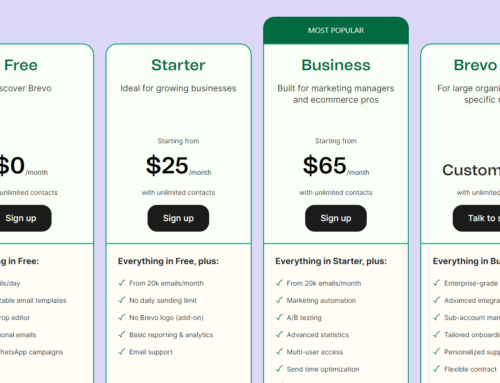
TheTool is suitable for anyone that wants to do performance based ASO, from single devs to large studios. It has 4 different packages to suite different types of clients, the Free one for very small devs, Startup (~$30/month) targeting indie devs/small teams, Growth (~$70/month) for medium-sized studios and Ninja (~$200/month) for big Kahunas.
What differentiates between these packages is how many apps can be tracked, the CSV Export/Annotations feature and lastly how many team members are allowed to access an account. Each plan has a free trial available so for 30 days you can install and test if it suits your needs. You can read more about the differences between these on TheTool.io – also, if you’ve tested it and have any comments feel free to leave your feedback on this page.
